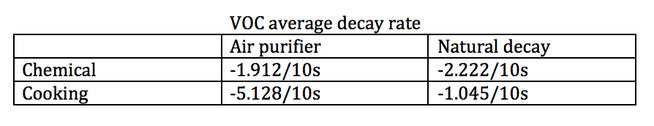
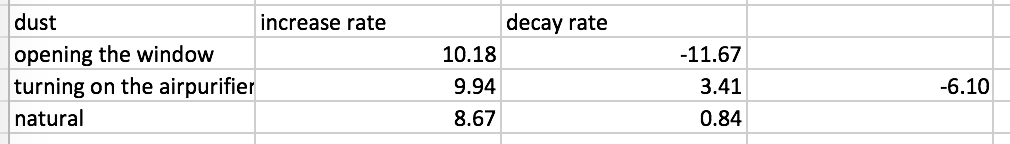
Conclusion one:
Air purifier filter particles from cooking better than from chemicals
For reducing VOC density, when spreading chemicals, opening air purifier has nearly the same effect as natural decay. In addition, VOC keeps a relatively high value (around 500) even after opening air purifier. However, when cooking bacon, opening air purifier decay 390% faster than natural decay. VOC also achieves a relatively low value (around 250) after opening air purifier.
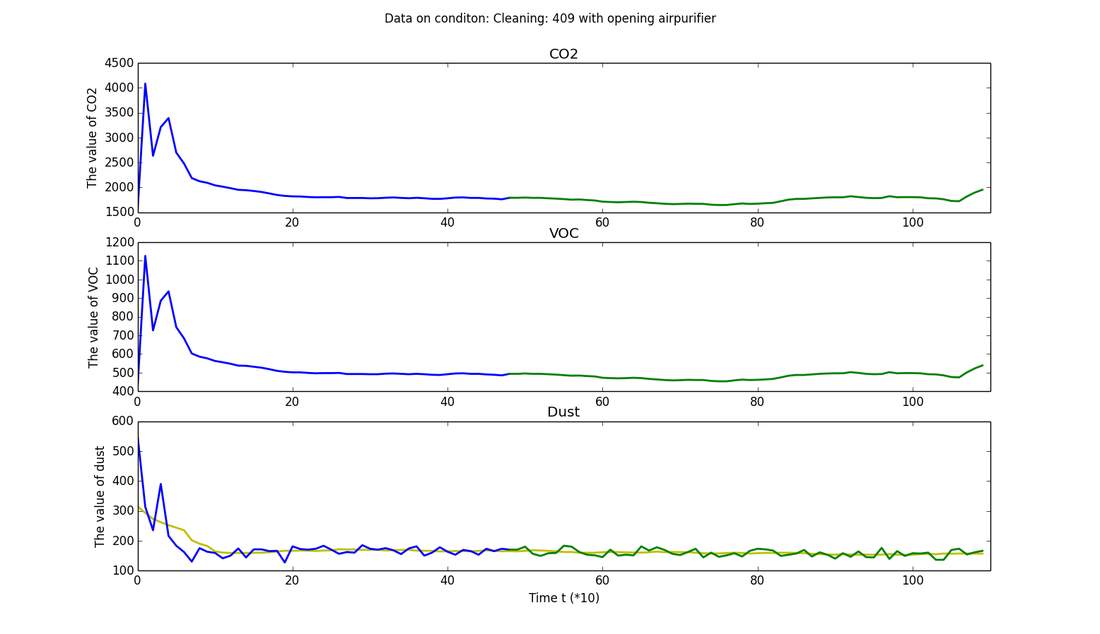
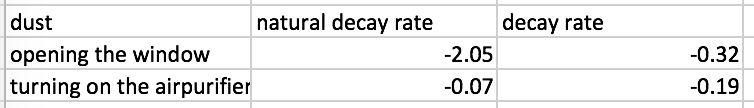
Air purifier for chemical e.g. 409 cleaning chemical
|
● blue line: naturally decay ● green line: open air purifier |
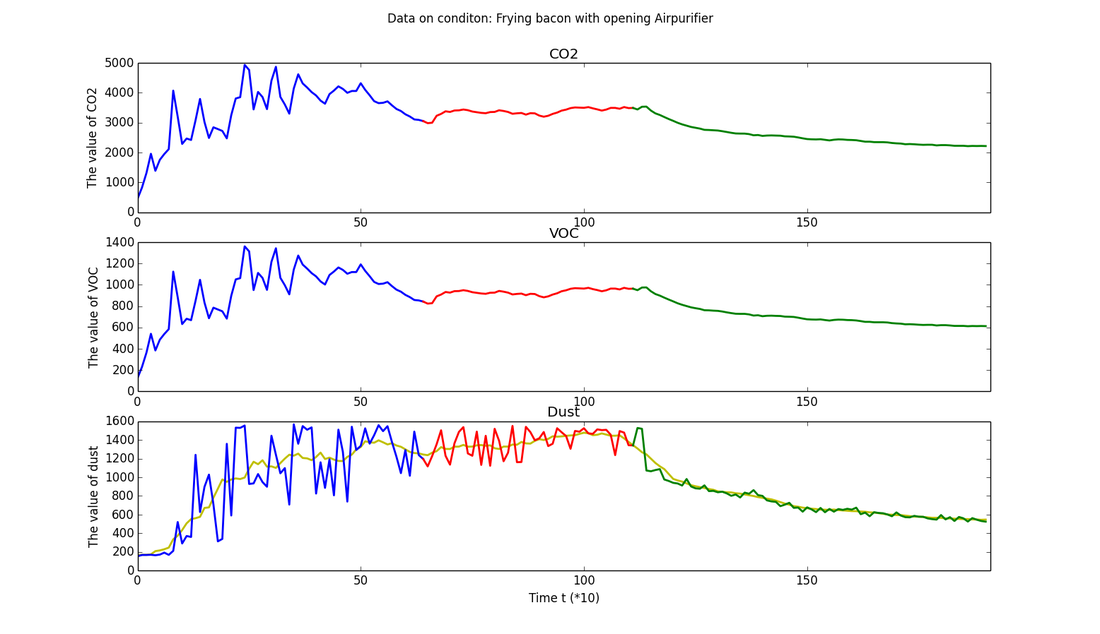
Air purifier for cooking e.g.cooking bacon
|
● blue line: start cooking ● red line: open air purifier ● green line: close the stove |
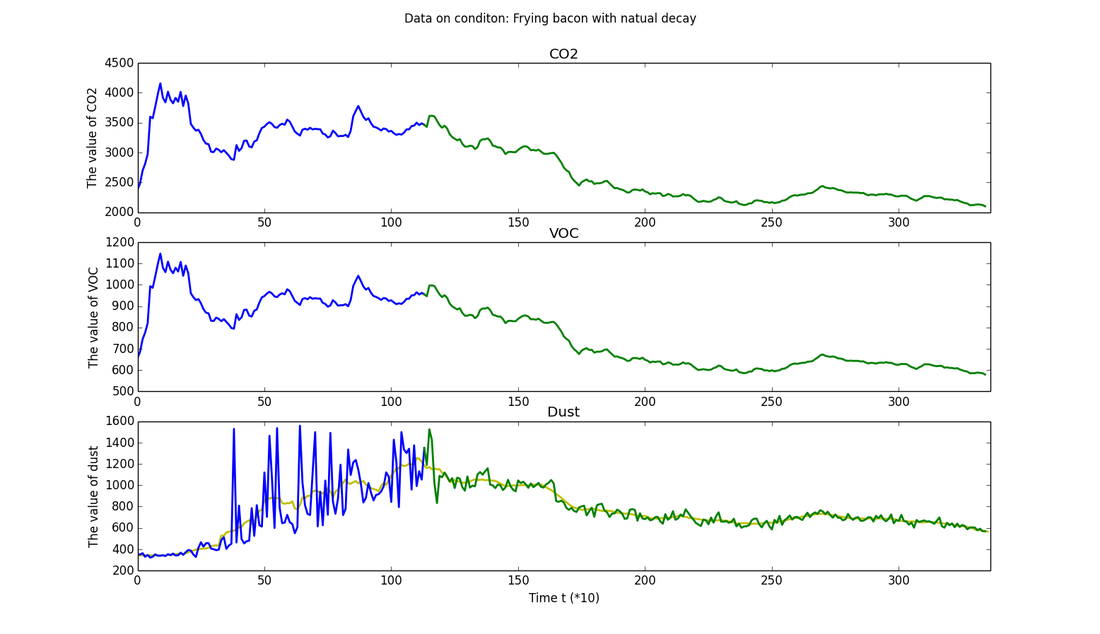
Natural decay for cooking e.g.cooking bacon
|
● blue line: start cooking ● green line: close the stove |
Conclusion two:
Differentiate between cooking and spreading chemicals
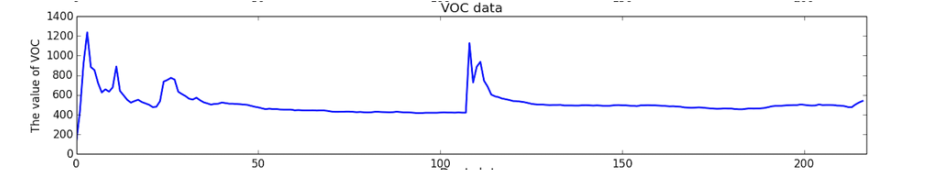
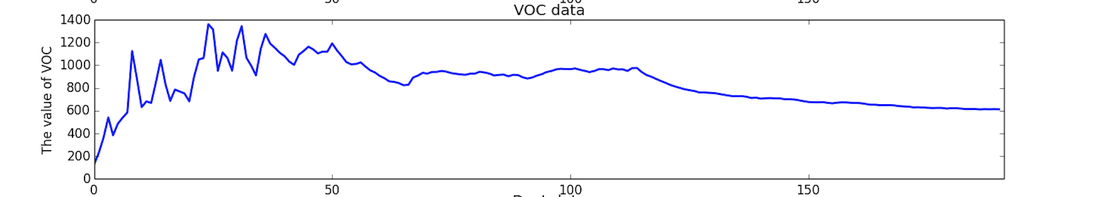
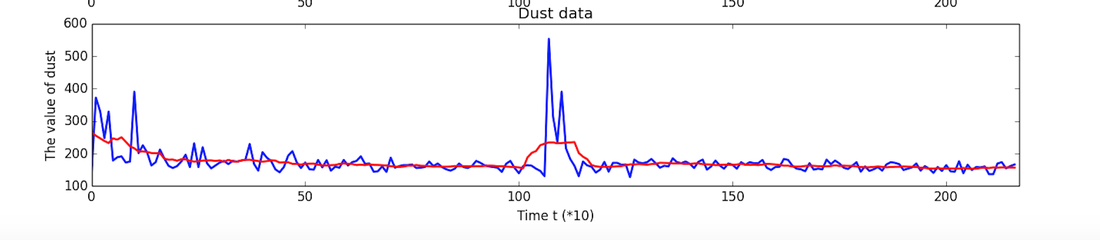
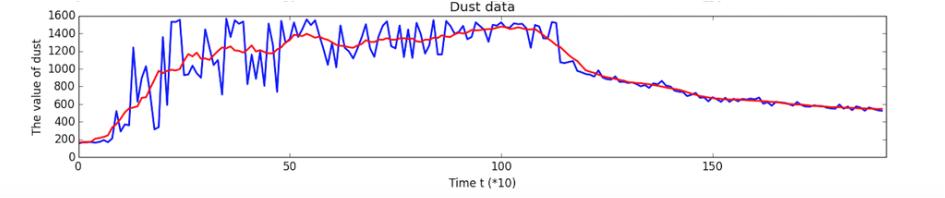
When spreading chemicals, VOC density increases rapidly, and then drops quickly right after spreading. Dust density also reaches peak at the time of spreading. For cooking bacon, VOC continues increasing for a long time, and then decreases slowly. For dust density, cooking generates more dust compared with their peak values. Cooking dust (i.e. 1600) is nearly 3 times of chemical dust (i.e. 600). In addition, dust density fluctuates rapidly especially when increasing.
VOC
● blue line: empirical data of spreading chemicals (spread chemicals twice at peak value)
VOC
● blue line: empirical data of spreading chemicals (spread chemicals twice at peak value)
● blue line: empirical data of cooking bacon
Dust:
● blue line: empirical data of spreading chemicals
● red line: moving average (calculated every 60 seconds)
● blue line: empirical data of spreading chemicals
● red line: moving average (calculated every 60 seconds)
● blue line: empirical data of cooking bacon
● red line: moving average (calculated every 60 seconds)
● red line: moving average (calculated every 60 seconds)
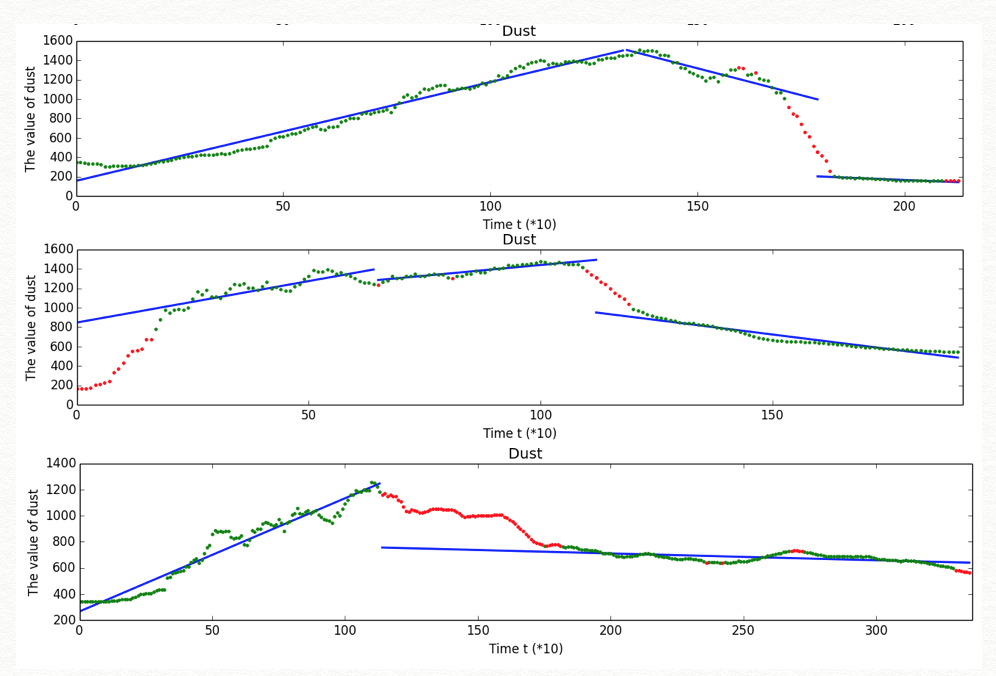
Conclusion three:
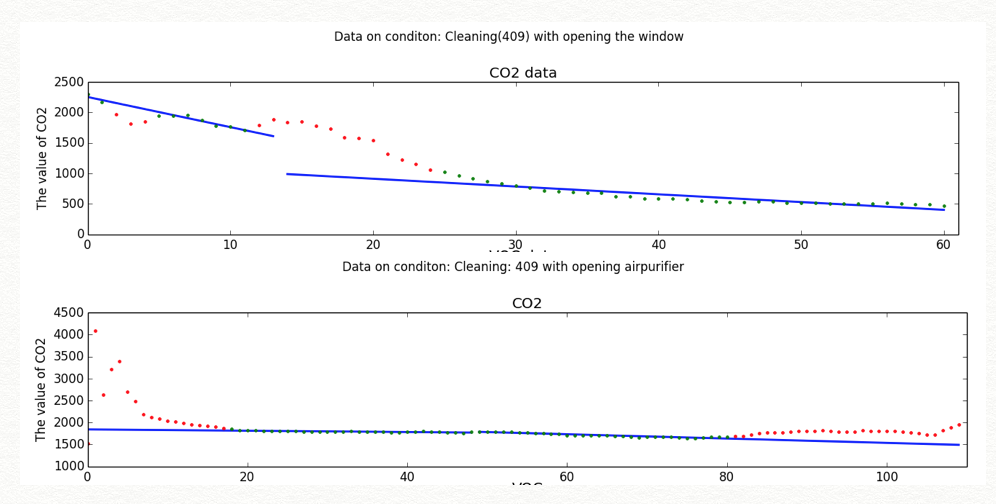
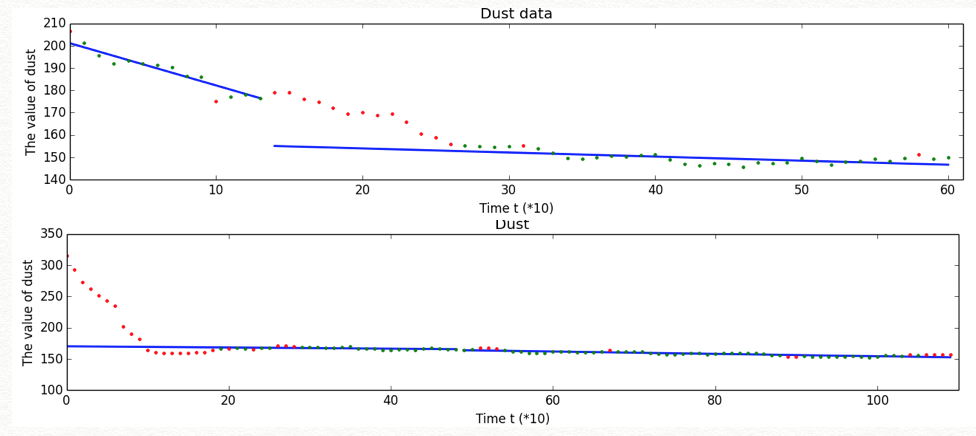
Pattern recognition based on decay function learned by RANSAC
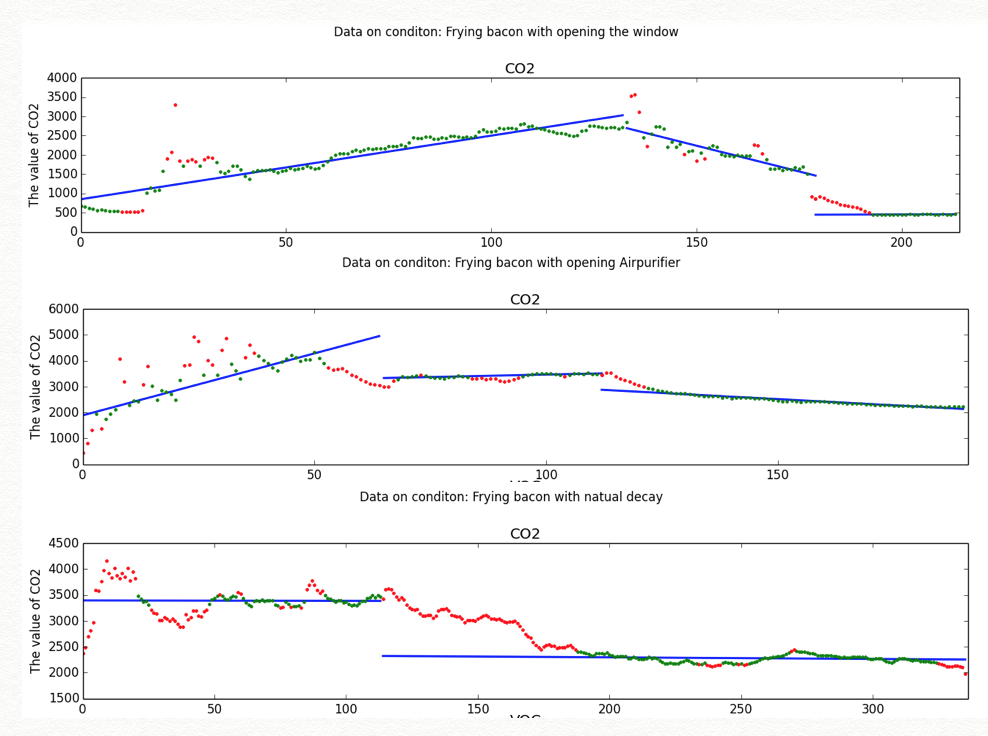
|
Cooking:
● the blue lines: RANSAC regression line ● the red points: Outliers ● the green points: Inliers 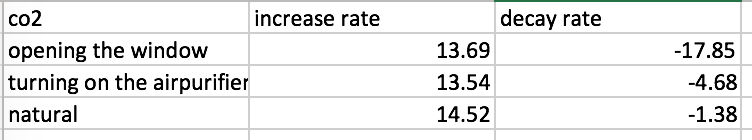
● When cooking bacon, our linear regression models for the decay process fits empirical data, and match conclusion one.
● We can use these models to predict time needed for common pollutants to reach a comfortable level, when opening windows or opening air purifier. |
|
Chemicals:
● the blue lines: RANSAC regression line ● the red points: Outliers ● the green points: Inliers 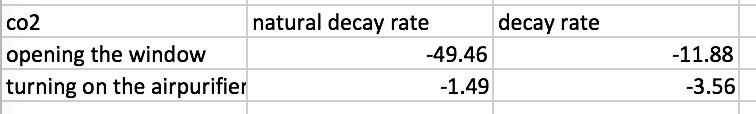
● When spreading chemical, our linear regression models for decay process of opening the window or opening air purifier fits empirical data, and match conclusion one.
● Meanwhile, we find that for the natural decay process, the linear regression models are not accurate enough, and we may use exponential regression to train a more appropriate model. |
● According to our analysis, firstly, we can apply pattern recognition to match new data one specific scenario, i.e. cooking or spreading chemicals. After that, given a set of regression functions, we can calculate the time needed to improve indoor air quality metric by taking the approach of opening the window or opening the air purifier.